 |
| What happens when I should be working on other things. |
I must be back in school, because once again I find myself unable to sleep because I'm busy thinking about something. Regular readers will recall that this was the reason I started the blog in the first place. So now, at 01:23, let's go into why I can't sleep. Fair warning: if you don't necessarily like or care about hockey, go ahead and skip this one.
I was partly inspired by this post by Cam Charron (all my figures are from stats.hockeyanalysis.com as well), and recent events. Tyler Bozak is injured and Nazem Kadri has taken his place as the Toronto Maple Leafs' first line centreman. In his article, Cam states that the common assertion that Bozak and all-star winger Phil "The Thrill" Kessel is simply not true. He goes on to point out that the numbers would indicate that Grabovski actually has better chemistry with Kessel. That, combined with the current fantastic output of Kadri, Kessel and James van Riemsdyk (JvR), led me to question whether or not there would be a way to easily quantify how much better players are depending on their centreman. That led to the scribbles you see above, which are more neatly recorded below:
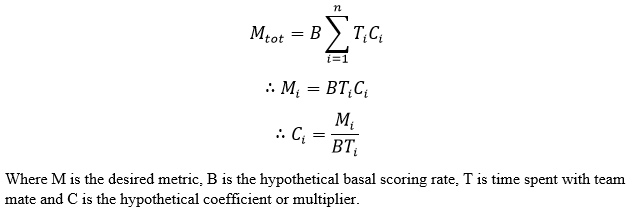
While many of my readers will have no problem reading that, and will doubtless find mistakes I made, I'll break that top line down a little bit. Stated simply, I assume that over the course of a season, a player's total output (goals, assists, points, what have you), could be represented as the sum of his performances with various centremen. More complexly stated, a player's performance is the linear combination of his performances with different centremen. The second line says more or less the same thing, but is specific to the points scored, and time with centreman i. The logical leaps start here. I say that the total metric achieved with that player would equal the product of the time spent with that centre, T, the [hypothetical] basal scoring rate, B, and the coefficient C. That means that, I assume, there is some rate at which the player in question would normally generate some metric, this will be multiplied by some coefficient depending on who the centre is and will also be time-weighted. Now, in a perfect world I would have a giant dataset and would simply plug the above equation into gnuplot and use its fit function to generate all relevant B and C values. Unfortunately, I don't have access to a large data set, and don't really have the programming ability to mine stats from the NHL. So I assume that B is equal to the basal, or average scoring rate of a given player (their total metric divided by their total time-on-ice (TOI)). I don't know whether or not a hypothetical B would differ from an average scoring rate, but the more I think about it, the more I think it would be the same.
In any case, we can see how to easily isolate a Centreman Coefficient from the data. This data, for the record, is from the Leafs' 2012-2013 season, which is old and only represents a half-season, but is still young enough to be relevant to today's roster. Let's take a look.
Table 1: Effect of Centres (left) on Wingers’
point production expressed as coefficient.
|
||||
Player
|
Kessel
|
Lupul
|
JvR
|
King MacArthur
|
Bozak
|
0.9747
|
1.8027
|
0.8990
|
0.8613
|
Grabovski
|
1.2205
|
0.0000
|
1.6356
|
0.5637
|
Kadri
|
1.4784
|
0.9312
|
0.8918
|
1.3539
|
Table 2: Effect of Centres (left) on Wingers’ Corsi
expressed as coefficient.
|
||||
Player
|
Kessel
|
Lupul
|
JvR
|
King MacArthur
|
Bozak
|
1.0509
|
1.2619
|
0.9971
|
1.2195
|
Grabovski
|
0.8225
|
1.8974
|
0.8681
|
0.9794
|
Kadri
|
0.8967
|
0.8800
|
1.0587
|
1.0456
|
I'll briefly point out to those of you not familiar with #fancystats that Corsi is simply the difference between shots for and shots against a player's team while he is on the ice. It also correlates very well with puck possession times. That's why it's used, because the NHL doesn't track offensive zone time, but shots are readily recorded. Go figure. I'll also note that I have apparently suffered amnesia about the whole of the Leafs' last season, because I don't remember who anyone played with, so I went with four wingers and three centres. Also, if you're not familiar with coefficients, look at it this way: in the case of Lupul, he was scoring at roughly double his normal rate when centred by Bozak, and 0 times his normal rate when centred by Grabovski. You could also call it a multiplier. So when centred by Bozak, Lupul is like Twopuls, and like no Lupuls when centred by Grabovski (by the by, I'm very tired...).
Conclusions? Well, barring the fact that I shouldn't have included Lupul's data because he wasn't around very much last season, we can see a couple things. One, and for reasons I can't really understand, it seems like Corsi and point production are inversely related in some cases. The only explanation I can offer is that your Corsi might suffer if you rush out and score, and are pulled off the ice, but other than that, I've got nothing. But then, the Leafs are especially challenging that way. One surprising thing is that, which point production appears to be supressed by Bozak, he improves the Corsi of his team mates when he is on the ice. Or rather, his wingers put up better-than-normal Corsi ratings when he is on the ice. This isn't to be expected, because Bozak is routinely ripped on for his Corsi. Kessel and JvR really liked playing with Grabovski, though their Corsi figures were suppressed at the same time. As for Kadri as a centre last year, I'm as confused as you are. I just... yeah.
Some other notes of interest involve disregarding the whole linear combination thing and just looking at how players perform with others. The data led to some hilarious conclusions like how different goalies correlated with different metric production. For the five minutes JvR played with Steckel, his point, goal and Corsi coefficients were 5.7, 11, and 2.4 respectively. Kessel did very well when Fraser was on the ice, his point and Corsi coefficients were 2.2 and 2.7. Also, Grabovski and Naz actually played together for 9 minutes, Grabovski scored twice and Naz recorded two assists in that time, and it led to similar hilariously large numbers.
I'll also say that while I can't find the piece of paper where I stashed the information I recorded while dickering with this idea, it appears that Bozak's point coefficient for Kessel was about 1.4 in the 9-10 season and has steadily decreased as the years go by. I'd be curious to see what happened with the Corsi coefficient over the same period, but I'm tired and I'm not going to do it right now. Also, considering Kessel for this year thus far, Bozak's point and Corsi coefficients 0.97 and 1.01 while Naz's are 2.01 and 0.76. Again, why is point production so high when Corsi is so low?
So what to make of all of this? Sure beats me, I don't even think the results are statistically significant. I think these coefficients are a nice and simple number to compare how wingers perform with a given centre. Or even another winger, or goalie, or whatever you feel like calculating. If anyone is interested, I can always forward the .xlsx I have, though you also have the equations above, which is really all you need. I'd say I hope you all find this terribly interesting, but frankly I'm happy to have gotten this down in a semi-organized fashion, and can hopefully go to sleep now.
NM
P.S. Is that the first equation on Vodka and Equations?
P.P.S. All data was for 5 on 5 situations.
P.P.S. All data was for 5 on 5 situations.
No comments:
Post a Comment